Off the Top: Scripting Entries

20052010201520202025

Showing posts: 1-15 of 36 total posts


10 October 2026

Links Weren't Linking

For more than a decade I have had a Python link checker I occasionally run against my Links :: vanderwal.net page. I regularly update the links page and the additions are manual inserts and reposting the page when I find something I’m regularly going back to, or want to go back to. About 18 months back my long used python script using Beautiful Soup (HTML parser) - Wikipedia needed updating the BeautifulSoup package and tweaking the script a little bit.

Over these last 18 months the bot / scraper / AI crawler wars have become a hot mess and running a link checker script, unknowingly was getting blocked by hosts / servers that are working to not get slammed by the orders of magnitude of increased traffic from non-organic sources. One method (among many) server owners deplay is blocking access to websites from requests with no user agent or an old user agent claim (as this is what a lot of the aggressive inorganic traffic uses). My old school link checker feels like a web version of Wall-E going around and checking to clean up my broken links and getting caught in the wake from large AI industrial retrieval ships.

Thursday I wanted to run my link checker and realized it wasn’t going to be all that helpful. I thought a quick edit of the script to add a more current user agent to the what is presented to the link’s server would help. I went with: “Mozilla/5.0 (Macintosh; Intel Mac OS X 10_15_7) AppleWebKit/605.1.15 ” “(KHTML, like Gecko) Version/18.0 Safari/605.1.15”. This one minor change when running the link checker removed about 200 false positive broken links.

With many things I have run and been doing for ages, my estimation of how much or how many of something is wildly off. Another minor tweak I made was to list the number of links tested on my Links :: vanderwal.net page. I have had a links page for two or three years longer than I have had a web domain. I set up this domain in 1997 and the site started with a homepage and a links page of things I wanted near in reach. My first link check I made on Thursday I had 943 links. Well, that was about double of my rough estimate.

Updating to Get Better Data

When I last updated the Python script to a new version of BeautifulSoup I didn’t really change much else. Now that things were less than optimal I noticed my Python script just used a default check, but wasn’t using GET. Adding GET would provide feedback as to the type of HTTP response codes I was getting and that would help reduce my manual checks of the list of “broken links”.

A quick test after adding GET had more updates and parsing needed. If I’m getting the actual responses back, I want to log the returned codes and information, but I really want that organized. The initial output of the checking is a long list of links with non–200 status with their state, the link, error code, if a redirect it tried the redirect and if a 200 it shows the “200” and the new link.

The initial output from running BeautifulSoup is the list in a temporary text document. The last part of the script runs through the text document and turns that list into a grouped list and table markdown file in my Notes directory that Obsidian watches over.

Structured Documents Made the Next Steps Easier

The structured Markdown note has sub-headings for the different returned link states. This works like a really good triage list. I could easily double-check the links marked as broken (404, 409, 500, and no DNS) in the table and added another column to the table for the checked status I provided. I had 52 of these and I went through them in about 15 minutes.

I made a back-up of the links page and verified git was current so I could rollback. I handed off the update to Claude Code to follow my notation of the section I just checked, my structured outcome note, and to follow one of the four processes I posted. It made the updates in seconds and I ran diff against the two files and the outcome was perfect.

I moved the outcome page to production and ran a commit. I ran the Python checker again and tackled a couple of small sections in the same manner. On my 3rd running of the checker I looked at the roughly 430 redirections captured. Since Claude had managed the two prior updates perfectly I had it handle the redirection updates. This too was processed quickly and the output links page was perfect on the manual check. But Claude Code running Opus 5.5 had additional notes from the update that included some redirects were not similar to the page historically that I linked to (in some cases the domain had changed hands years ago and Claude derived context from surrounding links that it was no longer a fit), noted that sites had changed languages, sites were now ads from domain resellers, and more. It had a list of links that could now be problematic. I wasn’t expecting this additional feedback and the feedback I checked was spot on and insanely helpful.

I ran the Python link checker a fourth time and I was down to 916 links on the page. Broken links gone, with many of my “archive” links gone too, which are the gray links as the linked site went from not being updated in years to now fully gone from the living internet. I have left things with this fourth pass of the checker on my to-do list. The links that are large sites with large organizations behind them are in the blocked connection or have “are you human” test in front of them, but still function. I have about 70 or so links that I need to manually go through and log what to do. Some no longer have the content I have long pointed to.

Outcomes

I’m happy with where the Python link checker ended up. The web is a lot more fragile than it seems like it ever was. I was surprised how many links had redirects (I have 50 that still need manual reviews). While I’m bummed many “archive” links are not on the page they were gone and they could be let go.

The two sections on the links page that took the biggest hit are the tech section and the “Urban Planning and Cities” section. Finding sites that fit the urban planning and cities perspective have always been tough to find. Losing some means I need to dig again.
Rearranging Automations and Aggregations

This week and the prior had a spattering of updates and reworking of some of my regular automations and aggregations.

I’ve posted about my automation patterns with scripts (mostly python), some AI (sometimes Claude), many web scripts and web services (IFTTT and a few others), many local scripts and triggers that one action for an intended purpose also pushes things to additional places (for aggregation, organization, and later retrieval), other patterns. I’ve written about some of this recently: My Automations Over the Ages and Today’s View and Adjusting Daily Aggregation for Less Friction.

I’ve long played with data to sort out what is in it, the shape of it, and possibilities in it (going back to before grad school – it was a large part of my second job out of undergrad and grad school expanded and honed it). This continues today with different tools and services. The ability to quickly build a proof of concept for data analytics and munge the data to get a helpful data visualization is something I’ve liked from AI services like Claude. I can test a workflow, set up a quick process for making use of the data and information I normally tuck away. Most often I’ll try something and if it works well I will modify it and move it out of Claude and into a python script (or set of python-based processes) to get a usable output I can gain insight from and/or work with. On occasion the data is not steady enough, so I will keep things in Claude and run scheduled automation to do the grunt work so that I have my aggregations in my Daily Dump markdown note I keep in my notes folder Obsidian looks over, and it is ready early in the morning for me to sort out what I continue with, what is fine, and what I need to process in some way.

Nearly all of my morning aggregations and automations are dealing with local (on my device(s)) data, information, and objects. I don’t want this going into anybody else’s service or cloud as it is foolish and pointless to do this. This is my Personal InfoCloud (see Overview of the InfoClouds – Personal InfoCloud) and it remains there not drifts out.

Claude Cowork Shift Local Scheduled Automations

A little less than a third of my morning automations and aggregations have run through a local Claude Cowork Scheduler. Anthropic announced it was not going to allow the creation of new Cowork Scheduled tasks and new ones (possibly modifications too) would need to move to the cloud. Uh… no! The options were to move fully to Python and/or other scripted workflows, move off of Claude, or move the scheduled tasks out of Cowork to Claude Code. I also had a few morning automation and aggregation tasks I kick off manually as they are based on me finishing my personal tasks.

Manually Mapping Out Flows in Obsidian Canvas Helps

A little more than a year ago I mapped out my morning and weekly workflow automations and aggregations with the services, scripts, tasks, time triggers, schedulers, and regular manually triggered tasks, automations, and aggregations. I mapped this rather quickly in Obsidian’s Canvas Obsidian Canvas that is helpful for seeing groupings, related processes through links, and flows. I went through my grouped tasks that I automated and marked the ones I needed to deal with using a yellow dot emoji. There were a few nested ones I hadn’t considered. (A great thing with Canvas is having a link to my notes in the automation node so I can quickly jump to see details.)

I have long used Claude Code for debugging code and suggesting optimizations to code (sometimes the suggestions are good and quite helpful, I moved to it after deep frustration with ChatGPT and GitHub Copilot poor output). Moving things to Code was relatively straight forward (it didn’t have the battles with time that were prevalent in Cowork, which was really frustrating until I sorted out a workaround so Cowork could understand “today”, “yesterday”, “past 24 hours”, etc – working with time can be problematic, but it mangled things that are relatively straight forward).

Move from Claude to Python Driven App, Triggered by Apple Shortcuts

I went to convert one of my manually triggered automations and realized it didn’t need to be in Claude at all, and was a good candidate to move python, but I would need to build a Slack app / bot to pull from my personal Slack instance. About 5 to 10 years ago building a Slack app was rather a common and straightforward endeavour. That changed a bit and the setup screens did too. Slack is now AI bot-friendly first and I’m not building an AI bot, but going in the opposite direction (I had used the MCP from Slack to run the aggregation prior). Rather than 15 to 30 minutes creating the Slack app it took around 90 minutes to deal with the changes in Slack. But, I also wanted an easier way to trigger the Slack app to run and capture the links to videos I had found interesting, and put them in a list in a markdown file, so I could take the next steps. I ended up using Apple Shortcut to trigger the Python script. The automation now is done in under a second rather than just under two minutes and no files uploaded anywhere.

I have two other automations I manually trigger that I can likely move to Python in the same manner using secure APIs and triggering them from Apple Shortcuts. I haven’t converted them yet.

The Shift to Code Started a Few Months Ago

In the past few months I moved a few of my Claude tasks I run for clean up of transcripts from Cowork to Code and found a large reduction in time, tokens, and Claude usage in that move. The quality of the shift has been better quality, output is more consistent, and also calls out potential issues on transcription clean-up (I pull podcast and YouTube transcripts which are riddled with errors and poorly structured, I don’t change the content but have proper sentence and paragraph structures, but also included some sub-headers). Some of the data conversion tasks and modifying script tasks that I would run or plan out in Chat or Cowork all moved to Code and the quality improved and token / usage all noticeably improved. The usage and quality improved when I started using Opus 5.5, with Sonar I had a lot of rework and Claude off and running changing things that were reviews not to change things. My token and usage decrementing is about a third less or better with Code and Opus 5.5, which doesn’t fully make sense.

The last push was moving my Daily Dump related aggregations and automations and the Weekly round-up out of Cowork as everything done is local with those tasks. The move from Cowork to Code was rather straightforward. I asked Claude Code to guide setting up the needed resource access it would need for its own processing and assistance setting up the Routines and its timing (Code’s routine timers aren’t precise and I wanted them running at the exact open times with locked windows I regularly run things within). That timing took had pushback from Claude but got it close to the window and then it took me understanding Code Routines have some odd buffers of a few minutes.

How it is Going

This took a chunk of time early in the week, but things are running fine. All but a couple of manually triggered tasks are now green check emoji and not yellow dots. Tomorrow morning when my Weekly roundup runs will be a big question and test.

The biggest friction points are the pieces I’ve moved to new homes and remembering where they get triggered. The upside with using Apple Shortcuts is that it can be organized rather well to keep things related together. I moved a lot of my local web servers that enable data visualization web apps to Apple Shortcut triggers while setting up other Shortcuts and that has helped the efficiency of those processes.


16 September 2026

I Wrote What?

Part of the impetus for writing this post has been driven by the updates at A new Observable | Observable, which I recently wrote about Large Observable Update :: Off the Top :: vanderwal.net, and looking at changes in not only Observable, but updates to D3 by Observable. These current and not-too-distant updates have had me thinking about what I could do with some of my blogging data to make interactive charts and graphs. I’ve recently moved a lot of my legacy static charts and graphs to Plotly to gain interaction with them, for many of my own uses. But, in the process of getting a decent data workflow setup for my site (and my notes data) I have relatively clean data locally ready for use and testing.

A Little Data Workflow Background

For this blog I have been pulling down the data from the site’s backend and converting it with a set python script to extract it to SQLite, which is relational but quite fast for reading data and is great for single user write and a few read options. Over the past few months I’ve also been building many data analytics and data visualization prep python scripts (some building JSON files for standalone webpage interfaces). I’ve used Claude to debug, but also just turn out a script in less than couple minutes for the page setup for the D3 or Plotly scripts, which would usually take me 30 to 120 minutes. Once the scripts are set and I’ve reviewed them it is all just setting python flags and minor tweaks to the script to handle a data update.

With these script setups I’ve been able to try quite a few D3 chart and graph options very quickly. Going through the Python code, the data structures for the visualizations, and the hooks for the visualization and I’m rather happy with it for quick outputs.

What Can I See Using Blaugust Data

One of the things I had interest in from my A Wrap to Blaugust / Blaugust run in August was what did all of that look like from a basic statistic and graphical perspective. A few months back I created and ran a bunch of Jupyter queries and visualizations, Personal Blog Data Analysis - Looking at 25 Years. Since then I’ve been thinking about looking at a monthly view with more interactive charts and graphs. Since I had a decent amount of data from August 2026, existing data workflows, and a few D3 charting and graphing options I could work with I took a look.

August Off the Top Force Graph

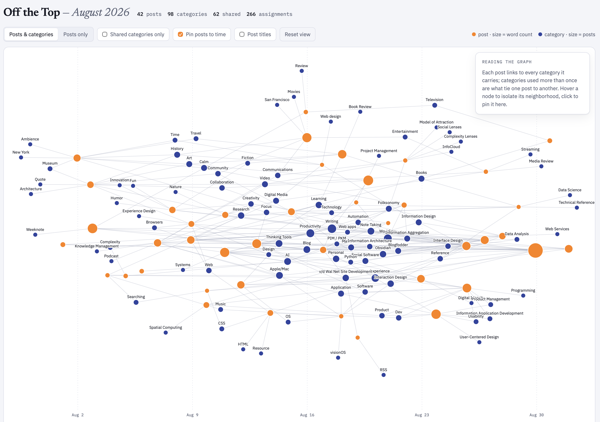
The first is an interactive forced graph with the blogpost as orange nodes with the size corresponding to word count and the tethered edges link to categories for the post. Clicking on the post will show the related categories and pulling on the post node will start to see the other tethered posts connected through the categories. There are few toggles: 1) Posts and categories or just Posts with their related interconnections; 2) Only show shared categories (a category with more than one post); 3) Post to Time, which may be my favorite view, as it take the graph and lays out the posts left (oldest) to right (most recent), with a small light timeline at the bottom and all the other relationships displayed as well; 4) Post titles, which clutters things a bit and adding the toggle resolved that clutter.

You can view this standalone interactive web chart that sits in the Lab :: Off the Top Analytics at the direct link: Off the Top, August Force Graph with Toggles. A sample is here:

A forged graph chart image showing August 2026 posts and connected categories

August 2026 Word Counts

As I was going through the data for August 2026 I knew and could see the word counts for posts, which I don’t have easily (nor quickly) available on my site. But, with the data local in SQLite and I’ve been using the local data to run many types of post analytics, word counts become a simple and quick option that doesn’t impact the site’s performance at all.

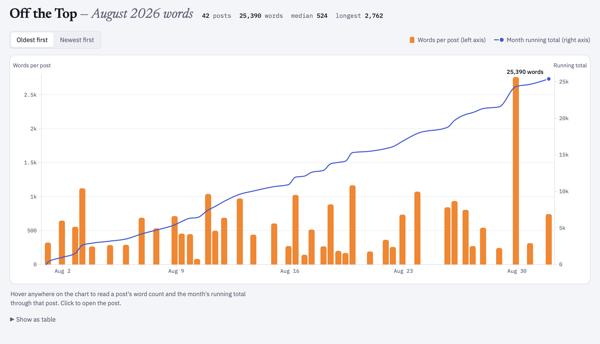
I was really curious about word counts per post across August, but also was more curious about a cumulative word count across the month as well. A quick and easy bar chart and line graph solved this, both having interactive hovers for metadata. August had 25,390 words posted.

The standalone interactive web chart is also in the Lab and the direct link is: Off the Top, August Word Counts by Post and Cumulative Count. A sample is here:

A bar chart image of monthly posts with height correlating to word count and a line above the bar chart showing cumulative word count for the month August 2026 posts

Cumulative Word Count for 2001 to 2026

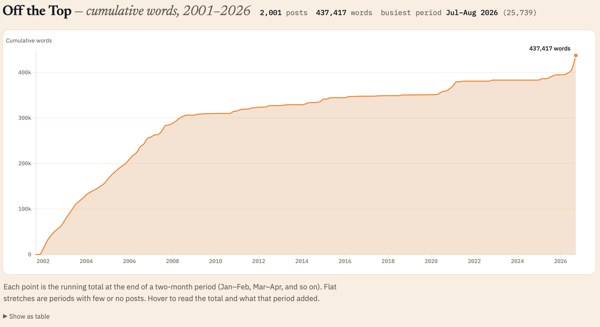
Looking at the cumulative count for August 2026 (the 25,390 words posted in the month) I had no idea what that count was in comparison to the whole life span of the blog (under this CMS that started in late October 2001 and not including the static posts prior to that). I know that in the early months and years of the blog I wrote a lot of short posts and the posts were frequent. Looking at word count I wasn’t expecting the first two or three years to have roughly the same growth slope up to 2008.

Looking across 25 years of posts I knew a single post analysis was going to be a bit rough for an interactive standalone webpage. Monthly would be better, but could still be a bit too much to process dynamically in the browser. Quarterly, was just a bit on the thin side and more difficult to see trend shifts and correlative line slope. I settled on a two-month interval and I had something interesting in under a minute.

July and August 2026 were the highest word count across all time on this blog. The 25 thousand words is roughly a quarter of a 250 page book. But, now that I had the bi-monthly chart I can also see the early years I had roughly similar counts per two months up until 2008 and then there was the “great flattening”, until the “great pandemica” lockdown when things ticked up again until lockdown ease and work went back to its normal patterns.

I ended up over the 25 years with 437,417 cumulative words just on this blog. That is roughly 4 books of 250 pages. It would be a rather odd book, but in just considering word count as the focus. I find word counts odd, particularly writing to word counts. I’ve had a regular column in tech publication that had a 750 rough word count topic, this was at a time when my posts were often 1,000 to 1,250 words on average and 750 words was about where I had the framing set to get to the meat of things. I mostly write on this blog to an amount where there aren’t good words left, which is 200 at times to 2,500 or more. To see my writing shifts in the early years roughly similar in trajectory rather interesting.

The standalone interactive web chart is also in the Lab and its direct link is: Off the Top All-time Cumulative Word Count. A sample is here:

A line chart showing cumulative word counts across 25 years of blog posts

Will this Continue?

Now that these are standalone webpage charts and graphs, I’m not sure what I will do. I need to get the templates consistent from a layout and design perspective. But, once the standalone webpage is created I just copy it to the Lab or other location, and this can be automated with a quick script. I think the month-by-month analytic is interesting, at least to me. I have not only the local standalone version that I posted, but a rough output build that isn’t fully self-contained that I can play with and iterate on.

If you like this and want to see more ping me on one of the services or send an e-mail using the Contact in the navbar.


9 May 2026

Automating the Daily Dump Note

In work and personal life I’ve long been an automator. It started in the ’90s, but actually started when I was a kid and talking with my dad about systems, making them more efficient, and removing steps, and automations. Any manual rote step I look at and think about making it a click or “just run”. I’ve used Obsidian since June 2020 and have a lot of things in my markdown notes trigged by TextExpander.

Reducing Steps Setting my My Daily Dump Note

Little by little I’ve been building out some automations for my note taking that sits under Obsidian’s watchful eye, but may start elsewhere or seeds start elsewhere. In the morning I run some automations that sweep up videos of interest I forwarded to myself from the prior evening or that morning that are in a personal instance of Slack. I have one that pulls in notes in Drafts with a specific tag then archives the note. One last piece I’d really like to add is to have my known items from across my calendars dropped in at the top of that Daily Dump note.

Getting the calendar dump is something I’d really like to have before I get to my laptop in the morning. But, each of these automations could and should be automated and dropped in the note before I fully get to it as well.

This takes one thing… having the note.

Creating the note with the series of headers and subheadings is something I usually do in a new markdown note with TextExpander each morning. But, I can’t automate with TextExpander (or I haven’t sorted out how to trigger that from a far).

Automating but Not with Apple Shortcuts

I started a couple days ago thinking that since I had Actions for Obsidian I could easily create a new Daily Dump with the correct future date as a title and have it trigger the Templater template for the note with the correct date. I quickly got the file created properly, but in over 4 hours that included a couple hours the following day it was still not working properly. This also included a few different apps and pieces and if any of them change it breaks.

Since I not only wanted to create one note with a template for the next day, but to have a few days ahead created (say a week at a time). I gave up on Shortcuts and in under 20 minutes I had a python script doing exactly what I wanted. This included setting up a cronjob to run it on Sunday evening and have a week of notes set.

Using the Output

This morning I opened Obsidian and one of the future day’s notes I had setup as tests was a click away and I was capturing an idea. This is a nice change and one I wished I had done long ago.

The next step is automating bringing in the aggregation automations notes and dropping that into my Daily Dump.


6 April 2014

Non-UNIX Timestamping has Me Stamping in Frustration

In the slow process of updating things here on this site I have nearly finished with the restructuring the HTML (exception is the about page, which everytime I start on it the changes I start to make lead quickly to a bigger redesign).

Taking a break from the last HTML page restructuring I was looking at finally getting to correctly timestamping and listing the post times based on blog posting location. Everything after the 1783rd blog post currently picks up the server time stamp and that server is sitting in Eastern Australia, so everything (other than blog posts from Sydney) are not correctly timestamped. Most things are 14 to 15 hours ahead of when they were posted - yes, posted from the future.

Looking at my MySQL tables I didn’t use a Unix timestamp, but a SQL datetime as the core date stored and then split the date and time into separate varables created with parsing timestamp in PHP. This leaves 3 columns to convert. It is a few scripts to write, but not bad, but just a bit of a pain. Also in this change is setting up time conversions that are built into the post location, but shifts in time for day light savings starts adding pain that I don’t want to introduce. I’ve been considering posting in GMT / UTC and on client side showing the posting time with relative user local time with a little JavaScript.

I would like to do this before a server / host move I’ve been considering. At this point I may set up a move and just keep track of the first post on the new server, then at some point correct the time for the roughly 500 posts while the server was in Eastern Australia.


16 January 2014

OmniOutliner Counts to Four

One of my favorite applications that a lot of my work and workflow lives in and through, OmniOutliner, updated today. OmniOutliner 4 finally was released today. Its interface becomes a little easier to use for more advanced functions, but if you use the iPad version the new Mac version now looks and works a little more like the iPad version (I think this is a good thing for consistency and ease of use).

I have been using OmniOutliner since version one. I learned to think and organize in outlines and I loved in the old days of WordPerfect the start a document in an outline and then start fleshing it out allowed me to work in the same manner I learned in the fourth grade in Mrs. Norman’s class at Raleigh Park Elementary. This seemed natural to prepare writing this way and once WordPerfect went missing from my workflow other writing tools faked outlines and I looked for good outlining tools to be that foundation. OmniOutliner filled this void. But, once I found OmniOutliner I found other fans who had scripted it to do really helpful tasks, like capture web site maps and dump them into OmniOutliner to annotate and arrange them, then use a script to push into OmniGraffle to visualize. Doing this in 2003 (or so) was pure joy. Not only was was OmniOutliner easy to use, it was really powerful because it was well structured and scriptable.

OmniOutliner is Where I Think

About 2003 I was asked by friend Jesse James Garret, “What tool to you think in?” At that point my answer was OmniOutliner. OmniOutliner was my capture tool that allowed for easy structuring and arranging of order. In years to come with OPML becoming the glue to connect many things in my workflow, I would would move my outlines from OmniOutliner to a mind mapping tool and back and forth. This moving the outline into a mind map allowed me to see it and see relationships spatially and to identify order, modify structure, and make connections between nodes in different branches of the mind map. From the mind map I could take all the modifications and move them back into the outline and tweak a little more. From this point it was moving into writing or into a Keynote presentation (also with a script that would take the OmniOutline and convert it to a presentation to flesh out visually).

The Initial Foundation of What Became OmniFocus

With OmniOutliner I went through the early productivity layer for it that later turned into OmniFocus. My old business started and was kept on schedule in that precursor to OmniFocus that Ethan Schoonover cobbled into and on top of OmniOutliner that was called Kinkless GTD (or KGTD for short).

I still think in OmniOutliner. I have all of the (now) 54 elements of the social lenses tucked in there with their hundreds of sub-nodes. This outline is what became the initial foundation for the four days of walk through of them with Dave Gray for what would turn into the Connected Company book. The collection of similar outlines are all within easy reach. I have a saved Spotlight search in the Finder sidebar that aggregate all my OmniOutliner files for one easy view across everything.

OmniOutliner 4 Offers Even More Potential

I really look forward to how OmniOutliner 4 becomes a new part of my world and workflows. The AppleScript looks robust (I didn’t try it in the many months of beta, but look forward to it now). With scripting and the structure there is a whole lot that is possible.


8 May 2012

HTML5 Demo Watch

Thanks to the Berg Friday Links I found the Suit up or Die Magazine and Cut the Rope HTML5 demo sites.

Both have me thinking this is really close, then I remember one of my favorite periodical apps, Financial Times went HTML5 more than a year ago. FT went HTML5 to better manage the multi-platform development process needed for iOS and the multitude of Android versions. While many have said the development is roughly 1.5x what it would take for just one platform development it does same incredible amount of time building an app across all platforms. Since all the major smart phone platforms have their native browsers built on webkit, there is some smart thinking in that approach.

Personally, my big niggle with the FT app is while it is browser based doesn’t have Instapaper built-in and it moves me out of the app to send a link of an article (often to myself because lacking Instapaper) rather than natively in the app, or exposing browser chrome so that I can do that while still remaining in the app and in reading their content mode. It would be really smart for FT to sort this out and fix these as it would keep me in the site and service reading, which I am sure they would love. If they could treat both of those like they do with Twitter and Facebook sharing out all within the app it would be brilliant.


2 May 2012

The Data Journalism Handbook is Available

The Data Journalism Handbook is finally available online and soon as the book Data Journalism Handbook - from Amazon or The Data Journalism Handbook - from O’Reilly, which is quite exciting. Why you ask?

In the October of 2010 the Guardian in the UK posted a Data Journalism How To Guide that was fantastic. This was a great resource not only for data journalists, but for anybody who has interest in finding, gathering, assessing, and doing something with the data that is shared found in the world around us. These skill are not the sort of thing that many of us grew up with nor learned in school, nor are taught in most schools today (that is another giant problem). This tutorial taught me a few things that have been of great benefit and filled in gaps I had in my tool bag that was still mostly rusty and built using the tool set I picked up in the mid-90s in grad school in public policy analysis.

In the Fall of 2011 at MozFest in London many data journalist and others of like mind got together to share their knowledge. Out of this gathering was the realization and starting point for the handbook. Journalists are not typically those who have the deep data skills, but if they can learn (not a huge mound to climb) and have it made sensible and relatively easy in bite sized chunk the journalists will be better off.

All of us can benefit from this book in our own hands. Getting to the basics of how gather and think through data and the questions around it, all the way through how to graphically display that data is incredibly beneficial. I know many people who have contributed to this Handbook and think the world of their contributions. Skimming through the version that is one the web I can quickly see this is going to be an essential reference for all, not just journalists, nor bloggers, but for everybody. This could and likely should be the book used in classes in high schools and university information essentials taught first semester first year.


20 September 2006

Understanding Folksonomy: Tagging that Works presentation posted

I have finally posted my Understanding Folksonomy: Tagging that Works (4MB PDF) presentation from d.construct. I have been presenting the content in this for nearly 2 years and have been iterating it. I have been wanting to get the Folksonomy Triad out in public as it has been getting really strong response in the 18 months that I have been using it (in the last 9 months I turned it into an animation that really drives the point home). I have not done a movie of the presentation yet, but that could be coming in the next few months.

I have not been posting the presentations, as the size has been increasing and when they get blogged elsewhere the bandwidth shoots up. But, I have been playing with Amazon S3 to store these files at lower cost and eat less bandwidth. I have been playing with the Python and Ruby scripts, but when Jeff Barr demonstrated the S3 Firefox Organizer I knew it was made really simple to upload, set permissions, and grab a sharable URL.


25 May 2006

Developing the Web for Whom?

Google Web Developer Toolkit for the Closed Web

Andrew in his post "Reading user interface libraries" brings in elements of yesterday's discussion on The Battle to Build the Personal InfoCloud. Andrew brings up something in his post regarding Google and their Google Web Developer Toolkit (GWT. He points out it is in Java and most of the personal web (or new web) is built in PHP, Ruby [(including Ruby on Rails), Python, and even Perl].

When GWT was launched I was at XTech in Amsterdam and much of the response was confusion as to why it was in Java and not something more widely used. It seems that by choosing Java for developing GWT it is aiming at those behind the firewall. There is still much development on the Intranet done in Java (as well as .Net). This environment needs help integrating rich interaction into their applications. The odd part is many Intranets are also user-experience challenged as well, which is not one of Google's public fortés.

Two Tribes: Inter and Intra

This whole process made me come back to the two differing worlds of Internet and Intranet. On the Internet the web is built largely with Open Source tools for many of the big services (Yahoo, Google, EBay, etc.) and nearly all of the smaller services are Open Source (the cost for hosting is much much lower). The Open Source community is also iterating their solutions insanely fast to build frameworks (Ruby on Rails, etc.) to meet ease of development needs. These sites also build for all operating systems and aim to work in all modern browsers.

On the Intranet the solutions are many times more likely to be Java or .Net as their is "corporate" support for these tools and training is easy to find and there is a phone number to get help from. The development is often for a narrower set of operating systems and browsers, which can be relatively easy to define in a closed environment. The Google solution seems to work well for this environment, but it seems that early reaction to its release in the personal web it fell very flat.

13 Reasons

A posting about Top 13 reasons to CONSIDER the Microsoft platform for Web 2.0 development and its response, "Top 13 reasons NOT to consider the Microsoft platform for Web 2.0 development" [which is on a .Net created site] had me thinking about these institutional solutions (Java and .Net) in an openly developed personal web. The institutional solutions seem like they MUST embrace the open solutions or work seamlessly with them. Take any one of the technical solutions brought up in the Microsoft list (not including Ray Ozzie or Robert Scoble as technical solutions) and think about how it would fit into personal site development or a Web 2.0 developed site. I am not so sure that in the current state of the MS tools they could easily drop in with out converting to the whole suite. Would the Visual .Net include a Python, PHP, Ruby, Ruby On Rails, or Perl plug-in?The Atlas solution is one option in now hundreds of Ajax frameworks. To get use the tools must had more value (not more cost or effort) and embrace what is known (frogs are happy in warm water, but will not enter hot water). Does Atlas work on all browsers? Do I or any Internet facing website developer want to fail for some part of their audience that are using modern browsers?

The Web is Open

The web is about being browser agnostic and OS agnostic. The web makes the OS on the machine irrelevant. The web is about information, media, data, content, and digital objects. The tools that allow us to do things with these elements are increasingly open and web-based and/or personal machine-based.

Build Upon Open Data and Open Access

The web is moving to making the content elements (including the microconent elements) open for use beyond the site. Look at the Amazon Web Services (AWS) and the open APIs in the Yahoo Developer Network. Both of these companies openly ease community access and use of their content and services. This draws people into Amazon and Yahoo media and properties. What programming and scripting languages are required to use these services? Any that the developer wants.. That is right, unlike Google pushing Java to use their solution, Amazon and Yahoo get it, it is up to the developer to use what is best for them. What browsers do the Amazon and Yahoo solutions work in? All browsers.

I have been watching Microsoft Live since I went to Search Champs as they were making sounds that they got it too. The Live Clipboard [TechCrunch review] that Ray Ozzie gave at O'Reilly ETech is being developed in an open community (including Microsoft) for the whole of the web to use. This is being done for use in all browsers, on all operating systems, for all applications, etc. It is open. This seems to show some understanding of the web that Microsoft has not exhibited before. For Microsoft to become relevant, get in the open web game, and stay in the game they must embrace this approach. I am never sure that Google gets this and there are times where I am not sure Yahoo fully gets it either (a "media company" that does not support Mac, which the Mac is comprised of a heavily media-centric community and use and consume media at a much higher rate than the supported community and the Mac community is where many of the trend setters are in the blogging community - just take a look around at SXSW Interactive or most any other web conference these days (even XTech had one third of the users on Mac).

Still an Open Playing Field

There is an open playing field for the company that truly gets it and focusses on the person and their needs. This playing field is behind firewalls on Intranet and out in the open Internet. It is increasingly all one space and it continues to be increasingly open.


31 December 2005

My Book Highlights from 2005

I had been hoping to do a longer post on things I enjoyed in 2005, but the year end has been a little busier than planned (it is a good thing). There are lot of books that I picked up in 2005 (possibly in the 30 to 50 range). Two from earlier in the year I really enjoyed, John Thackara's In the Bubble: Designing in a Complex World was a huge favorite. It has brought to mind many changes that we need to address as people who design and build things. The second was Personal, Portable, Pedestrian : Mobile Phones in Japanese Life by Ito, Okabe, Matsuda (editors), which provided insight into the Japanese mobile culture. Some of the cultural aspects to dot translate to the United States, but it does a wonderful job of raising awareness for introspection into one's own culture. The book also does a fantastic job of providing history and technological change and differentiation in use based on product types.

The couple months I have picked up some books that I will really have an impact on me. Shaping Things by Bruce Sterling my be my favorite book of the year (with the Thackera a close second). Shaping things gets to where we are going with design in an innovative way. The design of the book is playful and makes for a quick read (unless it gets your mind wondering in wonderful ways, as it did mine). It is a book I could not more highly recommend.

I finally picked up DOM Scripting: Web Design with JavaScript and the Document Object Model by Jeremy Keith and was pleasantly impressed with the coverage of pages that degrade properly. This book is required reading for anybody doing JavaScript or AJAX so to stop the madness with sites that do not work across browsers or mobile devices. There are far too many sites that have developers that did not learn anything from the mid to late 90s and using JavaScript that are making unusable sites, pages, and applications today. If you are a manager of interface developers this is written in a manner that it should be easy to read and make sure the developers working for you are following these guidelines.

My favorite fun book was recently released book in Britain, Against the Wall by and about Banksy. This is a collections of Banksy's street art and wonderful sense of play. I personally find it a great book to break through conventional thinking and get to the other side. This book is not currently available in America, which is an utter shame.

I may do a posting on music from 2005 I really enjoyed in the next day or so. But on this note, I wish you a wonderful new year and great things.


30 May 2004

Make My Link the P-link

Simon hit on plinks as an echo to Tim Bray's comments and variation on Purple Numbers (Purple Numbers as a reference). As I have mentioned before, page numbers fail us and these steps are a good means to move forward.

Simom has also posted in more plinks and in there points to Chris Dent's Big Day for Purple Numbers.

I have been thinking for quite some time about using an id attribute in each paragraph tag that includes the site permalink as well as the paragraph with in that entry. This would look like: <p id="1224p7">. This signifies permanent entry 1224 and paragraph 7 with in that entry. What I had not sorted out was an unobtrusive means of displaying this. I am now thinking about Simon's javascript as a means of doing this. The identifier and plink would be generated by PHP for the paragraph tag, which would be scraped by the javascript to generate the plink.

The downside I see is only making edits at the end of the entry using the "Update" method of providing edits and editorial comments. The other downside is the JavaScript is not usable on all mobile devices, nor was the speed of scrolling down Simon's page that fluid in Safari on my TiBook with 16MB of video RAM.


16 April 2003

Using HTML tags properly to help external search results

There are some essentials to building Web pages that get found with external search engines. Understanding the tags in HTML and how they are (rather should be) used is important. The main tags for most popular search engines are the title, heading (h1, h2, etc), paragraph (p), and anchor (a). Different search engines have given some weight in their ranking to metatags, but most do not use them or have decreased their value.

Google gives a lot of weight to the title tag, which is often what shows in the link Google gives its user to click for the entry. In the title tag the wording is important too, as the most specific information should be toward the front. A user searching for news may find a weblog toward the top of the search ahead of CNN, as CNN puts its name ahead of the title of the article. A title should echo the contents of the page as that will help the ranking of the pages, titles that are not repeated can get flagged for removal from search engines.

The headings help echo what is in the title and provide breaking points in the document. Headings not only help the user scan the page easily, but also are used by search engines to ensure the page is what it states it is. The echoing of terms are used to move an entry to the top of the rankings as the mechanical search engines get reinforcement that the information is on target for what its users may be seeking.

The paragraph tags also are used to help reinforce the text within them.

The anchor tags are used for links and this is what the search engines use to scrape and find other Web pages. The text used for the links is used by the search engines to weight their rankings also. If you want users to find information deep in your site put a short clear description between the anchor tags. The W3C standards include the ability to use a title attribute which some search tools also use. The title attribute is also used by some site readers (used by those with visual difficulties and those who want their information read aloud to them, because they may be driving or have their hands otherwise occupied) to replace the information between the anchor tags or to augment that information.

Example

The application I built to manage this weblog section is build to use each of these elements. This often results in high rankings in Google (and relatedly Yahoo), but this is not the intent, I am just a like fussy in that area. It gets to be very odd when my posting weblog posting review of a meal at Ten Penh is at the top or near the top of a Google Ten Penh search. The link for the Ten Penh restaurant is near the bottom of the first page.

Why is the restaurant not the top link? There are a few possible reasons. The restaurant page has its name at "tenpenh" in the title tag, which is very odd or sloppy. The page does not contain a heading tag nor a paragraph tag as the site is built with Flash. The semantic structure in Flash, for those search engines that scrape Flash. Equally the internal page links are not read by a search engine as they are in Flash also. A norm for many sites is having the logo of the site in the upper left corner clickable to the home page of the site, which with the use of the alt attribute in a image tag within an anchor link allow for each page to add value to the home page rant (if the alt attritute would have "Ten Penh Home" for example).

Not only does Flash hinder the scapeing of information the use of JavaScript links wipes out those as means to increase search rankings. Pages with dynamic links that are often believed to ease browsing (which may or may not prove the case depending on the site's users and the site goals in actual user testing) hurt the information in the site for being found by external search engines. JavaScript is not scrapable for links or text written out by JavaScript.


This work is licensed under the Creative Commons Attribution-NonCommercial-ShareAlike License.