Reading Information and Patterns
The past few weeks and months the subject of reading, analysis, and visualization have been coming up a lot in my talking and chatting with people. These are not new subjects for me as they are long time passions. Part of the discussion the past few weeks have been focussed on what is missing in social bookmarking tools (particularly as one's own bookmarks and tags grows and as the whole service scales) as wells as group discussion monitoring tools, but this discussion is not the focus of this post. The focus is on reading, understanding, and synthesis of information and knowledge.
Not that Reading
I really want to focus on reading. Not exactly reading words, but reading patterns and recognizing patterns and flows to get understanding. After we learn to read a group of letters as a word we start seeing that group of letters as a shape, which is a word. It is this understanding of patterns that interact and are strung together that form the type of reading I have interest in.
Yesterday, Jon Udell posted about analyzing two gymnasts make turns. He was frustrated that the analysis on television lacked good insight (Jon is a former gymnast). Jon, who is fantastic at showing and explaining technologies and interactions to get to the core values and benefits as well as demoing needed directions, applied his great skill and craft on gymnastics. He took two different gymnasts doing the same or similar maneuver frame-by-frame. Jon knew how to read what each gymnast was doing and shared his understanding of how to read the differences.
Similarly a week or so ago an article about the Bloomberg Terminal fantasy redesign along with the high-level explanations and examples of the Bloomberg Terminal brought to mind a similar kind of reading. I have a few friends and acquaintances that live their work life in front of Bloomberg Terminals. The terminals are an incredible flood of information and views all in a very DOS-looking interface. There is a skill and craft in not only understanding the information in the Bloomberg Terminal, but also in learning to read the terminal. One friend I chatted with while he was working (years ago) would glance at the terminal every minute. I had him explain his glancing, which essentially was looking for color shifts in certain parts of the screen and then look for movement of lines and characters in other areas. He just scanned the screen to look for action or alerts. His initial pass was triage to then discern where to focus and possibly dive deeper or pivot for more related information.
The many of the redesign elements of the Bloomberg Terminals understood the reading and ability to understand vast information (in text) or augmented the interface with visualizations that used a treemap (most market analysts are very familiar with the visualization thanks to SmartMoney's useage). But, the Ziba design was sparse. To me it seemed like many of the market knowledge workers used to the Bloomberg Terminal and knew how to read it would wonder where their information had gone.
Simplicity and Reading with Experience
The Ziba solution's simplicity triggers the need in understanding the balance between simplicity just breaking down the complex into smaller easy to understand bits and growing into understanding the bits recollected in a format that is usable through recognition and learned reading skills. The ability to read patterns is learned in many areas of life in sport, craft, and work. Surfers look at the ocean waves and see something very different from those who do not surf in the ebb, flow, breaks, surface currents and under currents. Musicians not only read printed music but also hear music differently from non-musicians, but formally trained musicians read patterns differently from those who have just "picked it up". There has been a push in business toward data dashboards for many years, but most require having the right metrics and good data, as well as good visualizations. The dashboards are an attempt to provide reading information and data with an easier learning curve through visualization and a decreased reliance on deep knowledge.
Getting Somewhere with Reading Patterns
Where this leads it there is a real need in understanding the balance between simplicity and advanced interaction with reading patterns. There is also a need to understand what patterns are already there and how people read them, including when to adhere to these patterns and when to break them. When breaking the patterns there needs to be simple means of learning these new patterns to be read and providing the ability to show improved value from these new patterns. This education process can be short video screen shots, short how-to use the interface or interactions. Building pattern libraries is really helpful.
Next, identify good patterns that are available and understand why they work, particularly why they work for the people that use then and learn how people read them and get different information and understanding through reading the same interface differently. Look at what does not work and where improved tools are needed. Understand what information is really needed for people who are interested in the information and data.
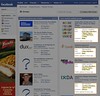 An example of this is Facebook, which has a really good home page for each Facebook member, it is a great digital lifestream of what my friends are doing. It is so much better at expressing flow and actions the people I have stated I have social interest in on Facebook than any other social web tool that came before Facebook. Relative to the individual level, Facebook fails with its interface of the information streams for its groups. Much of the content that is of interest in Facebook happens in the groups, but all the groups tell you is the number of new members, new messages, new videos, and new wall posts. There is much more valuable information tucked in there, such as who has commented that I normally interact with, state the threads that I have participated in that have been recently updated, etc.
This example illustrates there needs to be information to read that has value and could tell a story. Are the right bits of information available that will aid understanding of the underlying data and stories? It the interface helpful? Is it easy to use and can it provide more advanced understanding? Are there easy to find lessons in how to read the interface to get the most information out of it?